NFL Photos | NFL Photography Gallery | NFL.com
Cynthia’s NFL prototypes
As a math person, coaches and evaluators tell me the only combine data points they really care about are the medical results, and then in the next breath, they'll tell me about how their way of analyzing results is an evaluation advantage.
My pre-draft model takes 15 seasons of NFL performance data and defines levels of success by position. I determine the blend of attributes at each position, grouping players into one of the following categories: elite, above average, average, below average or well-below average. I use advanced math, computer vision and machine learning to uncover patterns that can be statistically validated.
One pattern that has emerged is players at the above-average and elite levels in the NFL exhibited Combine results that fell within specific ranges.
Below are some of these key ranges showing how historical above-average and elite NFL-level players tested. As you watch the Combine unfold, compare how each prospect tests with the prototypes of the past.

Prototype Ranges: Hand size: 9.375-10" Luck is my NFL QB prototype standing at 6'4" with a 10" hand size and a 40-yard dash time well below the average Pro Bowl QB since 2003 (4.79). Using combine metrics to develop the QB prototype is not the best method, but hand size has been a valuable tool in assessing ball security.
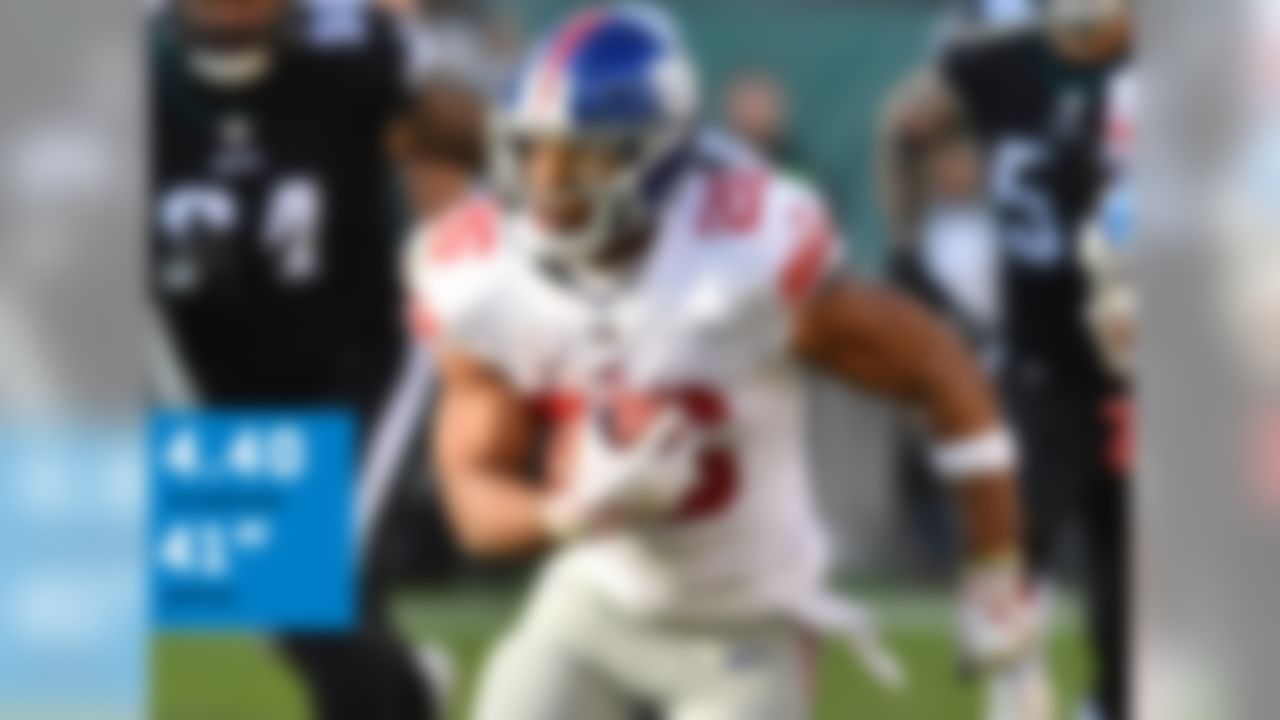
Prototype Ranges: 40-yard dash: 4.44-4.67 Vertical: 35-40" NFL teams are looking for speed and explosiveness from an every-down back, and Barkley proved he had both last year with his 40 and vertical. Add 29 bench reps, the most among any Pro Bowl RB since 2003, and you have a complete back.

Prototype Ranges: 20-yard shuttle: Below 4.40 (must be faster than 40-yard dash) 3-Cone: Below 7.00 As the RB position evolves, teams are placing more emphasis on receiving threats out of the backfield. Elite pass-catching backs show higher correlations to 3-cone and short shuttle results, evaluating their short-area quickness.
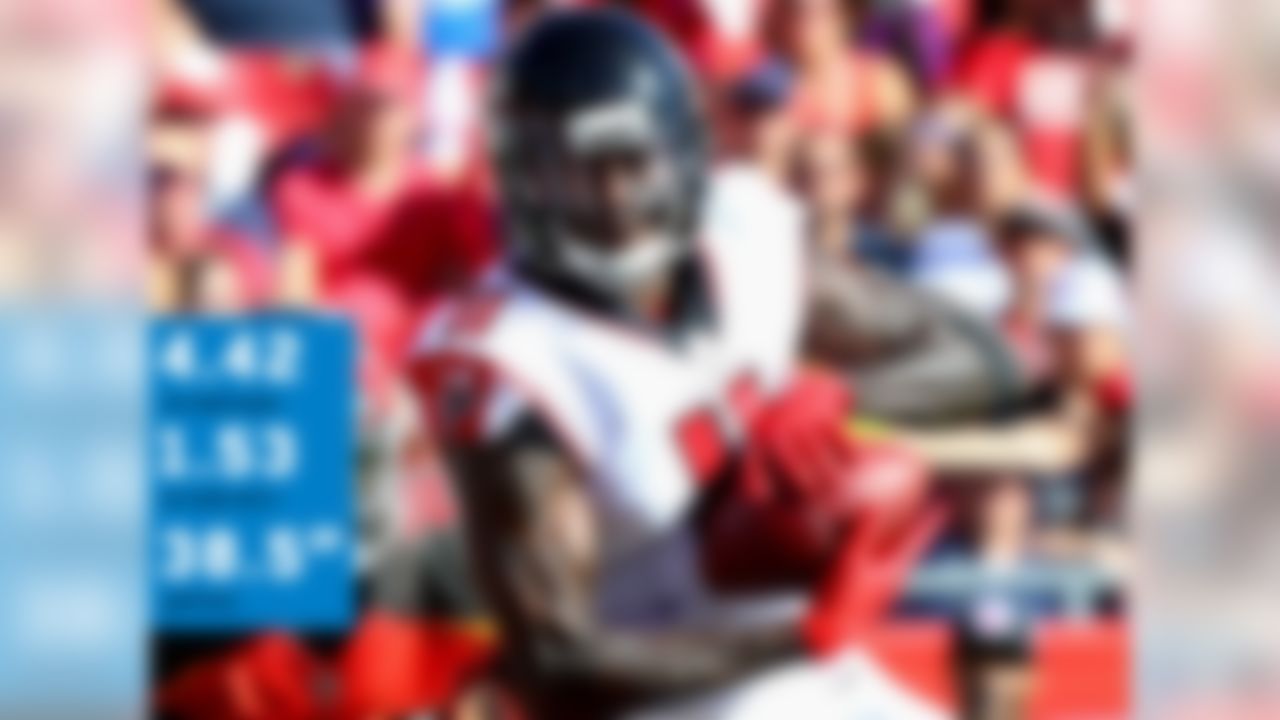
Prototype Ranges: 40-yard dash: 4.43-4.51 10-yard split: 1.53-1.61 Vertical: 35.5-38.5 My model identifies both the 40-yard dash and the 10-yard split as crucial for wide receivers. The quicker a receiver is off the line of scrimmage, the more likely he gets open. Julio Jones is able to get to top speed quickly, making his defender's job that much more difficult.

Prototype Ranges: 10-yard split: 1.55-1.69s Vertical: 32.5-36.5" As you see with receiving RB, slot receivers have stronger correlation with the short shuttle and 10-yard split of the 40-yard dash. Their short-area quickness is imperative as slot receivers are generally targeted closer to the line of scrimmage.
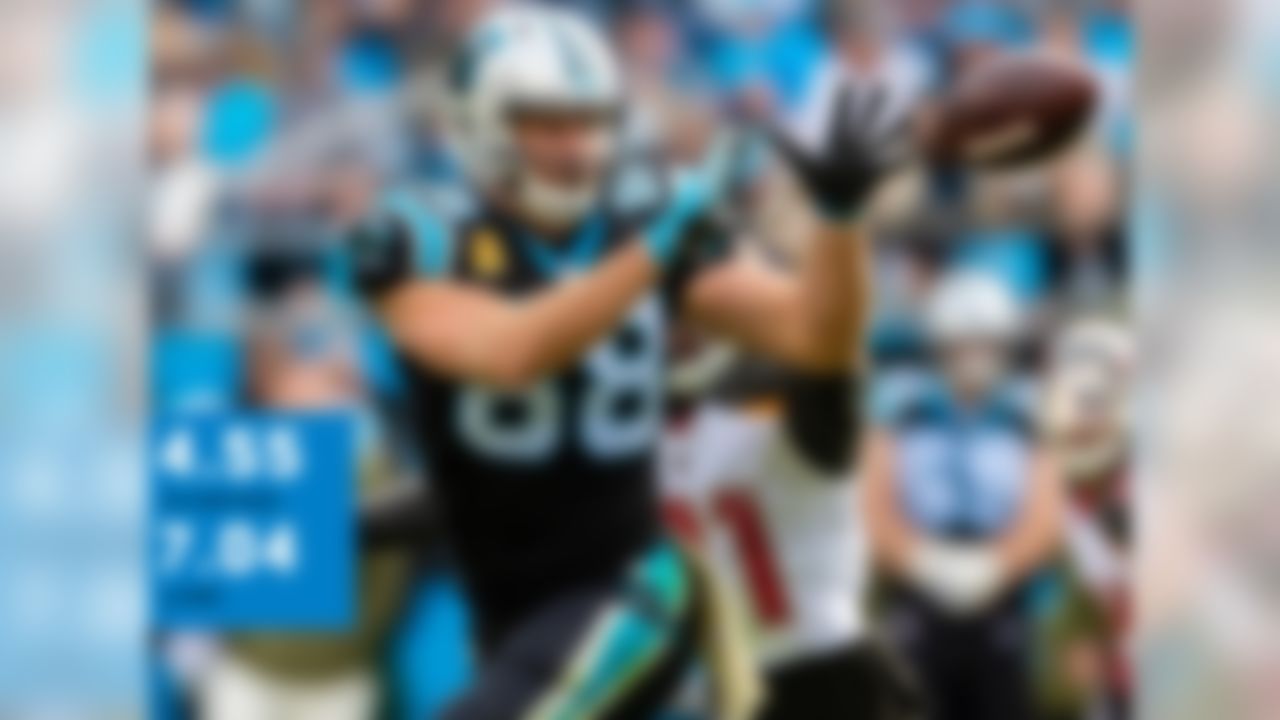
Prototype Ranges: 40 yard-dash: 4.69-4.88 3-Cone: 7.05-7.22 The NFL is seeing a younger crop of lighter, faster tight ends, but my model identifies the prototype. The 40-yard dash and 3-cone times have the strongest relationship with above-average and elite tight ends between 250-266 pounds.

Prototype Ranges: Arm length: 33.5-35.5" 10-yard split: 1.7-1.82 Armstead has the fastest 10-yard split among any Pro Bowl offensive lineman since 2003. His ability to stay low for the first 10 yards demonstrates balance. His 34.5" vertical shows exceptional explosion, which he uses to get out of his set at the snap of the ball.

Prototype Ranges: 20-yard shuttle: 4.50-4.72 3-Cone: 7.44-7.71 The most predictive metrics for interior offensive lineman are arm length, the short shuttle and 3-cone drill. Bitonio also ran a sub-5.0 40-yard dash (4.97), a metric that does also correlate to success on the interior.
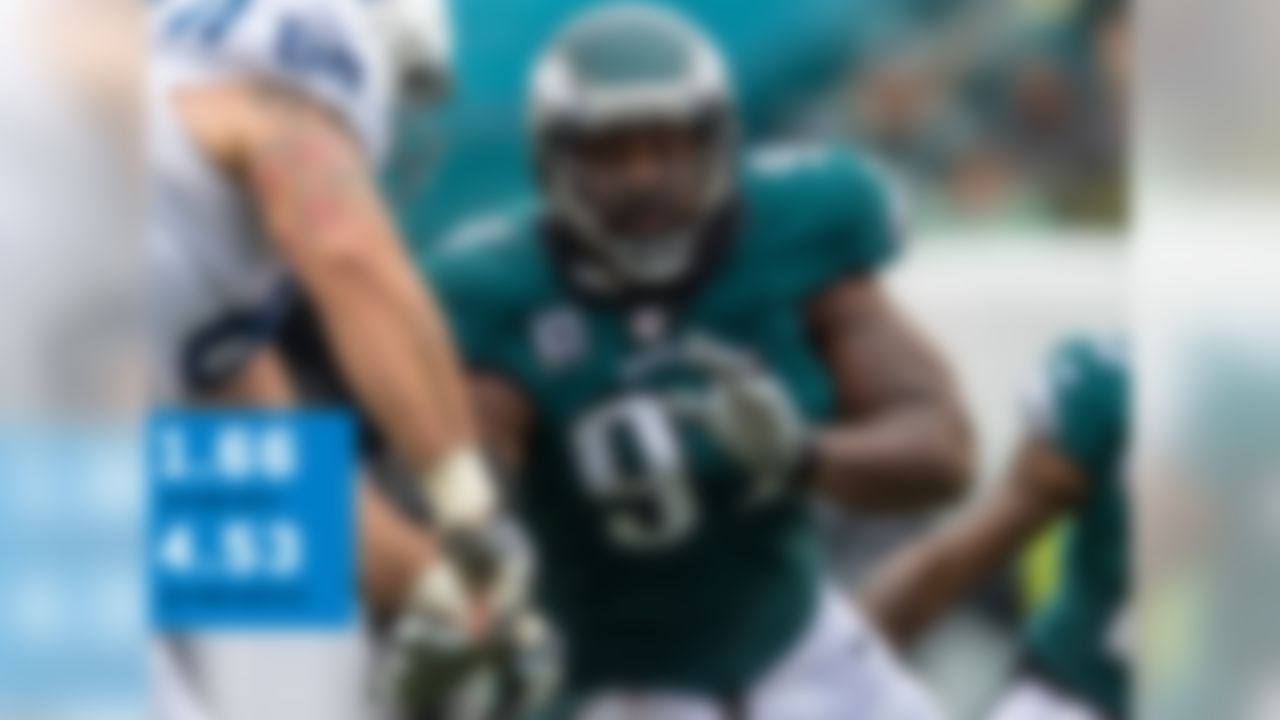
Prototype Ranges: 10-yard split: 1.69-1.83 20-yard shuttle: 4.46-4.62 The first 10-split of the 40-yard dash, broad jump and short shuttle are the three tests to watch here. The most elite DT in the league have about a 0.35 second-or-better improvement between their 40 and their short shuttle.

Prototype Ranges: 10-yard split: 1.65-1.81 20-yard shuttle: 4.29-4.45 The same drills that matter for DT also matter for edge rushers, but the prototype ranges change. Watt was a workout warrior with a 37" vertical and a 6.88 3-cone drill at 290 pounds.

Prototype Ranges: 20-yard shuttle: 4.19-4.33 3-Cone: 6.90-7.02 As defensive personnel shifts to more and more nickel, the 3-cone drill and short shuttle results have become more correlated to elite edge and hybrid rushers. Miller's 4.06 short shuttle and 6.70 3-cone time are the best among any LB to make the Pro Bowl since 2003 at the combine.

Prototype Ranges: 40-yard dash: 4.62-4.76 Vertical: 35-37.5" Inside linebackers must show range going sideline-to-sideline while also having the lower-body explosion to take on and get off blocks. Pairing these results with quick shuttle times, Kuechly has become a five-time first-team All-Pro selection.
Prototype Ranges: 40-yard dash: 4.42-4.55 20-yard shuttle: 4.05-4.20 3-Cone: Under 7.0 Don't get me wrong, the 40 is important for corners. However, my model indicates the short shuttle and 3-cone drill are more important. Think of it this way, most plays the corner starts by running backwards, so being able to change directions quickly is a must.
Prototype Ranges: 10-yard split: 1.57-1.63 Vertical: 36-39" With the continued emphasis of the passing game on offense, all safeties must be able to play back. Players with a quick burst who are explosive enough to high point the ball, such as Berry are the prototypes.


